
As users visit your website while you sleep, do you ever get a slight gnawing feeling – like you’ve left a small child alone while you went for milk?
Let’s face it – you really have no idea how they’re behaving. Are they wandering lost? Are they stuck somewhere? Are they doing their chores?
That’s how I feel sometimes. Your users often get misdirected, lost or simply don’t know what they are doing at your site. What’s more, they may break something or get hurt themselves by making bad decisions (e.g. delete some important data of theirs).
I’m part of the Dragdis build team, a tool designed specifically to help creative professionals collect and organize their inspirations. If you’re designing for seasoned creative pros, you need to think especially carefully about interactions, and make every usage scenario perfect.
We like to say “Your path has to have flow”

The truth is, no matter how well-researched your UX decisions may be, it’s impossible to predict all possible use cases. So, we need to obtain user behavior feedback as early as possible to make the appropriate design adjustments.
Furthermore, if you’re involved with a startup, your goal is to close that feedback loop for Lean UX as rapidly as you can.
So, in this article I will cover basics how to get feedback (statistical data) about your UX from the moment you roll out your design.
Why Google Analytics (GA)
Though Google Analytics is widely considered a tool for marketing purposes, it offers a powerful feature set that may well be a salvation for any UX researcher needing immediate insights without adding a new layer of tools.
Here’s why we ultimately selected GA as our main UX research tool:
- While most UX tools gouge your budget, a basic GA account is free of charge. There’s no need to go Premium, as the free data is more than enough for what we need.
- The flexibility GA provides is almost limitless. You can set it up to observe usage trends, actions, track errors… too many to list here. It’s really up to you to extract answers need.
- Visualization of your data is one of best ways to understand it. GA allows to you slice and dice your data in multiple ways and then display it in a wide range of charts.
- It’s simple to deploy. Paste in a small snippet of JavaScript and you are ready to go.
Of course, GA can’t do everything. Tasks that require off-site data such as eye tracking or observations during usability testing will need be conducted with other UX tools.
Basics on GA tracking structure
Before you begin with your user analysis with GA, you should be familiar with basic levels of GA tracking. In your GA, you can have multiple Accounts, Properties and Views:
- The Top level is ‘Account’. You should use this to separate individual projects or websites you want to track, such as example.com or test.org
- ‘Properties’ offer you a way to separate concerns in a single project. Let’s say that example.com has some public pages for user acquisition and internal pages for already registered users. These should become separate properties since they have different purposes. In that way your user flow and metrics will be kept clear and distinct.
- ‘View’ is just another level of your data separation. It is useful if you want filter and additionally process incoming data from your website to see different contexts.
Hint: if your site has different sections for different user groups (e.g. registered users and the new visitors), you should always split them into different GA properties – otherwise you will see inaccurate conversion rates for your goals.
Things to track
When you are setting up your GA or configuring a report, first you should have a clear idea of what you want to discover. Here are the 5 simplest tracking features you’ll need for basic UX analysis.
1. Standard Pageview tracking for starters
By default GA provides you standard tracking code that observes how your user is navigating, along with some parallel data that tells some details about your users (i.e. the tech they use, how they arrived at your site). Basic tracking allows you to answer these simple questions:
- Where did users enter and where do they leave your website?
- What paths did they take through your site?
- What technology did they use (mobile or desktop, screen resolution, OS, etc…) ?
Since standard tracking is more oriented towards marketing, generally you will likely only receive superficial insights from it, as it tracks only actual pages, and not the user interactions WE want to know about.
However, we can easily make it more powerful by pimping up your tracking code with virtual page hits to observe user behavior in more detail. ‘’Virtual page hits’ means you have to set GA up manually by calling a tracking function every time a user performs an action what you want to track.
For example, if you want to know if your users are opening a particular tab or loading another gallery item that does not reload your whole page, you can just add a single line of code in your JavaScript, that tells GA to track the particular interaction as a page hit.
ga('send', 'pageview', '/your-custom-pageview');
2. Behavior flow
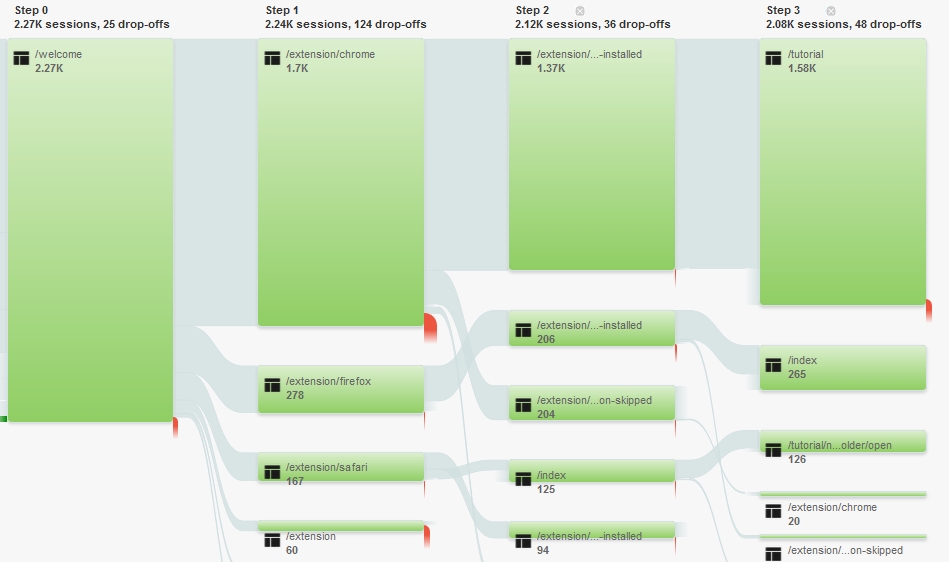
The shiny new pearl you get when you have your pages set up is the Behavior flow (Under Behavior section). This is a GA report that tells you exactly how your users are navigating your website.
This particular report is useful to:
- Analyze how users behave at a particular point of your flow
- See what happens immediately before/after users take a particular step or visit a particular page
- Investigate the precise sequence that users perform different interactions
- Isolate whether users are taking any unnecessary steps, or returning to previous states for any reason
- Determine which steps in your scenario fail most often (when the users doesn’t behave as you intended)
Once you get to this new report, select view type “Automatically grouped pages” and you will see all your user flow in visualization like the one below. If you click on a particular page (or step), you will be able to highlight the traffic through that page – or even set it as starting reference for all visualization (menu option Explore traffic through here)
3. Funnels are awesome
Funnels and Goals are features designed to observe your most sensitive data – the “if’s” and “how’s” your website fulfills its purpose.
Goals in GA usually represent your website objectives (sales conversions is a common objective) and Funnels are a predefined set of steps your users take to that goal.
Goals are set up in the Admin section of GA for each view individually. In other words, you can have different goals in different context for same website. For instance, a newsletter subscription page has a different goal to your checkout.
For the beginning you should set goals for every objective of your website, like “Order completed” or “User registered”. This will tell GA how to calculate conversions and will deliver fine performance reports.
Funnels, on the other hand, are the real treasure here. You can define up to 20 steps for each goal and later analyze the performance of each of these steps. This is some fine-grained control!
Each step represents a page hit or virtual page hit, it’s only limited by your imagination. But generally the best practice is to create a funnel step at any point that a users is able to abandon your scenario.
You should use Goals and Funnels to:
- Track how your well website is completing its objectives
- Locate the points in your scenario where it fails
- Monitor overall performance of your scenario
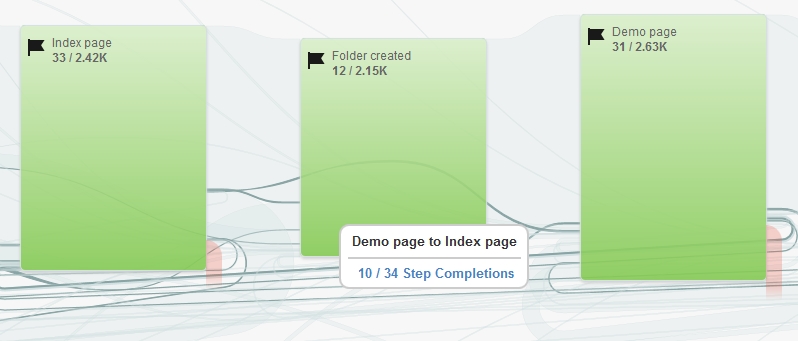
One you set up your goals, you will be able to use reports in Conversions section. Goal flow report will offer you the same sort of insights as Behavior flow, though from the perspective of goal completion. Here you will be able analyze how users are jumping between funnel steps and see where they leave your funnel or jump back into it.
This makes it much easier spot the flaws in your scenario logic and easily identify the breakpoints where your users get lost.
Another powerful report is Funnel visualization where you will see all your funnel performance in single view – it will show how much each step is effective (how many users pass it successfully towards a goal) and where users go if they leave your funnel at a particular step.
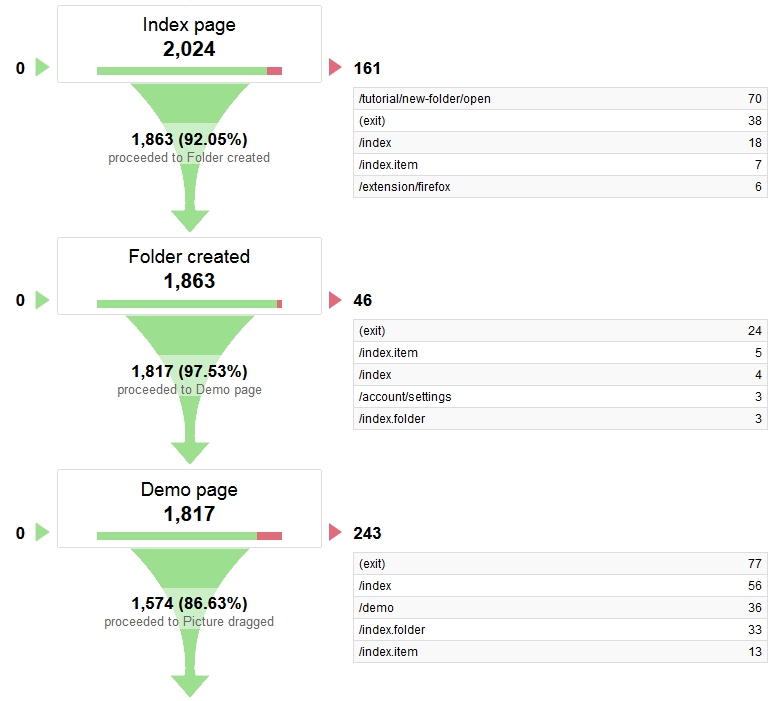
Funnel visualization differs from Goal flow in a way that Funnel visualization report “fills in” steps if users are skipping them and represents a Funnel as straight forward scenario. Goal flow reports show how users actually navigate between steps.
Hint: if your funnel step shows 0% (none users pass) or 100% (all users pass) conversion – probably there is something wrong with your funnel setup. There should be at least some passes and some turns at every step – and the steps with lowest conversions clearly indicates where you should improve your UX.
4. What features your users are grinding
Details and micro-interactions matter a lot if you want to create a smooth user experience, though you cannot track them as a pageviews since it would interfere and scramble with data within behavior flow reports. Here GA Event tracking lends a hand.
Events in GA represents a standalone action that your users are taking, so it is perfect to track such interactions as Context menu opening or List view change. All events are custom and each event have 4 properties, that you define yourself:
- Category is just a value for grouping events just for convenience (e.g. Index page events; Onboarding events)
- Action is a short name that represents event itself – here you should be specific
- Label (optional) user to track additional text data
- Value (optional) user to track additional numeric data that can be used as a metric in custom reports
Hint: Naming your event Action in past tense verb, helps you to create more intuitive and readable reports. E.g. “Settings icon clicked”, “Notification dismissed”
To track an event, you need to add different line of code, similar to pageview tracking. E.g.:
ga('send', 'event', 'Category', 'Menu click', 'Menu item title', 100);
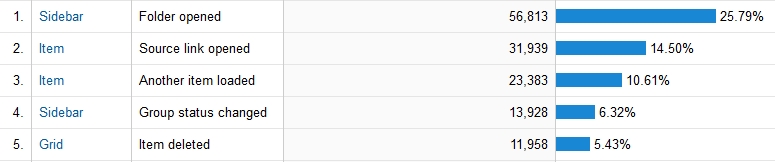
All Event reports can be accessed under Behavior -> Events section. Most useful report here is Top Events where you can see what action your users performs most usually.
Hint: if you want to see all events listed in a single plain, just select Event Action as your secondary dimension and if you select view table by Performance to visually represent intensity of every action.
5. Timing matters
Time is often overlooked in UX, but at some time there will be a time when you will need to track time. By measuring timing you can determine if users are hitting a sticking point in your path, or find themselves unable to complete a given task.
This method will help you answer the following questions:
- How quickly did users reach their goal in your website?
- How much time did a given operation or action takes?
- What points of your website keep users waiting?
- Which micro-interactions are confusing or demand more time than others?
To provide you with answers to these questions GA has implemented a feature called User timings. It is another custom hit type designed to measure time – how long things take in your website.
Perhaps counter-intuitively, GA itself does not provide a timing function, so the trick is that you will need to measure time by any means you have (e.g. simple timestamp comparison in javascript) . After that just provide timing data in your custom hit tracking code, where you have to specify 4 parameters:
- Category is just a value for grouping your timing events (same as simple Events)
- A short name that represents event itself
- Time in milliseconds
- Label (optional) user to track additional text data
ga(‘send’, ‘timing’, ‘Category’, ‘Watched video for’, 1000, ‘Some custom text’);You will be able to analyze all your tracked timings in User Timings report under Behavior -> Site Speed section. Same as in Event report you will be able to see all your timing events in single view if you select Timing Variable as your secondary dimension.

So where to begin?
Collectively these 5 features basically can collect you a treasure trove of data, but it in the end it only matters how you are going to analyze it. You don’t have to implement all of these tracking features together just because you can
Just treat them as tools for answering questions and collecting feedback. Just start with a question that needs an answer and see what GA reports can teach you.
Frequently Asked Questions (FAQs) on Using Google Analytics for UX Research
How can I use Google Analytics to improve my website’s user experience (UX)?
Google Analytics is a powerful tool that can provide valuable insights into how users interact with your website. By analyzing data such as bounce rates, page views, and conversion rates, you can identify areas of your website that may be causing frustration or confusion for users. For example, a high bounce rate on a particular page may indicate that users are not finding the information they need, suggesting that the page’s content or layout needs to be improved.
What specific metrics in Google Analytics should I focus on for UX research?
Some key metrics to focus on include bounce rate, exit rate, average session duration, and pages per session. These metrics can provide insights into user behavior and engagement. For instance, a high exit rate on a specific page might indicate that users are not finding what they’re looking for, suggesting a need for improvement in content or navigation.
How can I use Google Analytics to track user behavior on my website?
Google Analytics allows you to track user behavior through features like Behavior Flow and In-Page Analytics. Behavior Flow shows the path users take from one page to another, helping you understand how users navigate your site. In-Page Analytics shows where users click on a page, providing insights into how users interact with your content.
Can Google Analytics help me understand my users’ demographics and interests?
Yes, Google Analytics provides demographic data such as age, gender, and location, as well as interest data like affinity categories and in-market segments. This information can help you understand who your users are and what they’re interested in, allowing you to tailor your content and design to better meet their needs.
How can I use Google Analytics to improve my website’s conversion rate?
Google Analytics provides data on conversion rates and the factors that influence them. By analyzing this data, you can identify areas where users are dropping off in the conversion process and make necessary improvements. For example, if users are abandoning their shopping carts, you might need to simplify the checkout process or provide more information about shipping and returns.
Can Google Analytics help me identify usability issues on my website?
Yes, Google Analytics can help identify usability issues. For instance, if a particular page has a high bounce rate, it may indicate that users are having difficulty finding the information they need or navigating the page. Similarly, a low average time on page might suggest that users are not engaging with your content, indicating a need for improvement.
How can I use Google Analytics to measure the success of my UX improvements?
You can use Google Analytics to track key metrics before and after making UX improvements to measure their impact. For example, if you make changes to improve the navigation on your website, you could track metrics like bounce rate and pages per session to see if these improve as a result.
Can Google Analytics provide insights into mobile user behavior?
Yes, Google Analytics provides data on mobile usage, including the number of users who access your site via mobile devices, their behavior, and the types of devices they use. This information can help you optimize your site for mobile users.
How can I use Google Analytics to understand user behavior across different channels?
Google Analytics allows you to track user behavior across different channels, such as organic search, social media, and email. This can help you understand how users find your site and which channels are most effective at driving traffic and conversions.
Can Google Analytics help me identify trends in user behavior over time?
Yes, Google Analytics allows you to analyze user behavior over time. This can help you identify trends, such as changes in the popularity of certain pages or shifts in user demographics. Understanding these trends can help you adapt your content and design to meet changing user needs.
 Petras Baukys
Petras is an UX designer and Front-end developer passioned about creating user interfaces backed by science. He experiments with bleeding-edge front-end technologies and is obsessed with neurodesign. Currently works at Dragdis in Vilnius, Lithuania.