
Designing and developing a product often involves a large team of people with different backgrounds and experiences who must be on the same page about the project goals, the user needs and behaviors, and even the component processes involved. This common understanding is often built with visualizations (commonly referred to as mappings). Mappings make sense of and describe various aspects and processes associated with a product.
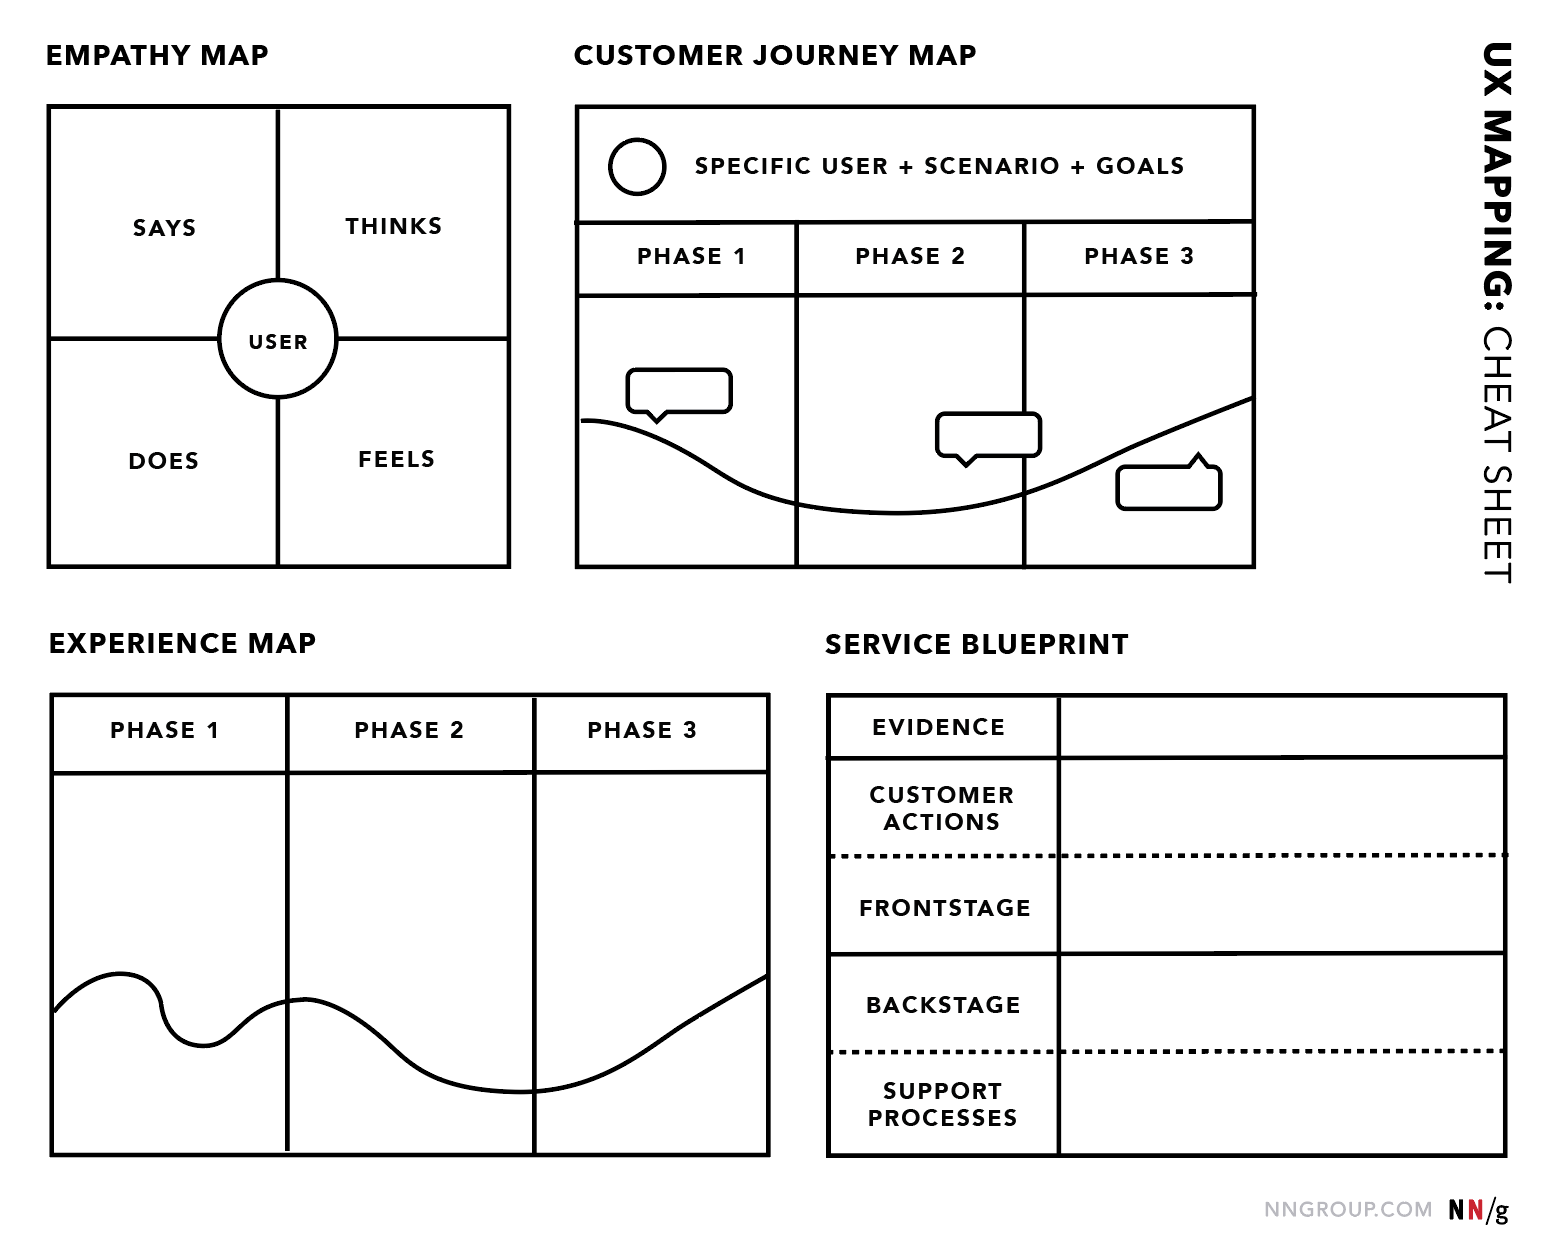
Four Types of Mapping
This article gives an overview of four commonly used mappings, their defining characteristics, and when to use which:
- Empathy mapping
- Customer journey mapping
- Experience mapping
- Service blueprinting
Additionally, this article will outline the decisions that must be made before creating any of these mappings in a simple three-step approach framework.
Empathy Mapping
Empathy maps help team members understand the user’s mindset.
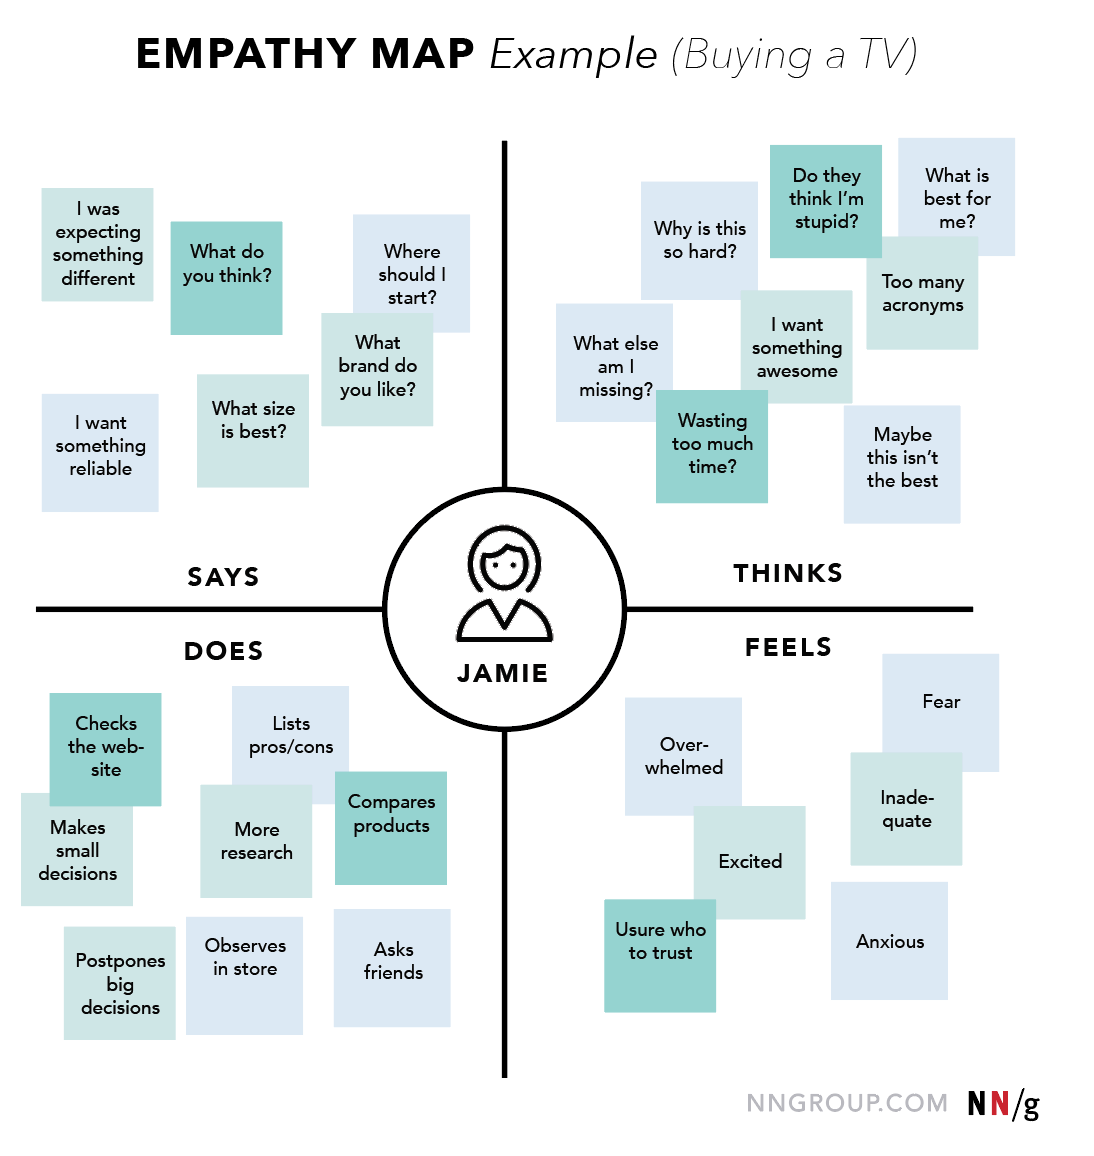
Empathy map: A tool used to articulate what we know about a particular type of user. It externalizes user knowledge in order to 1) create a shared understanding, and 2) aid in decision making.
Characteristics:
- The map is split into 4 quadrants: Says, Thinks, Feels, Does.
- It shows user’s perspective regarding the tasks related to the product.
- It is not chronological or sequential.
- There is one empathy map for each persona or user type (1:1 mapping).
Why use it:
- To build empathy for your users
- To force alignment and understanding about a user type
When to use it:
- Beginning of any design process
- When categorizing research notes from a user interview
Customer Journey Mapping
Customer journey maps focus on a specific customer’s interaction with a product or service.
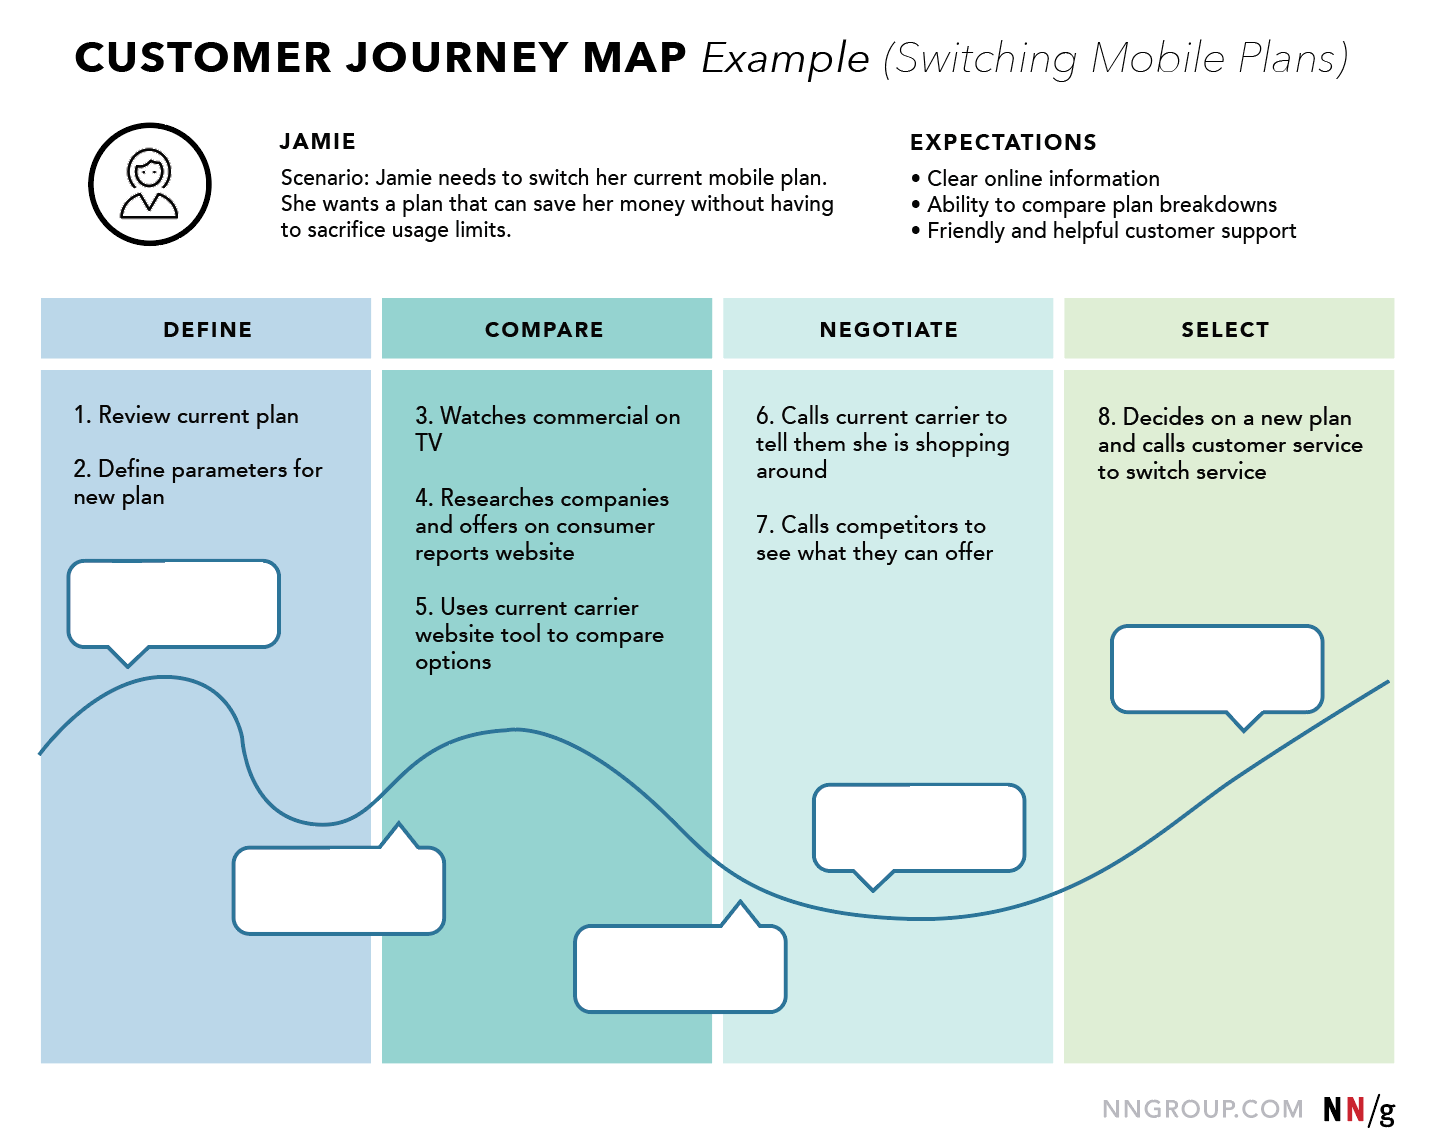
Customer journey map: A visualization of the process that a person goes through in order to accomplish a goal tied to a specific business or product. It’s used for understanding and addressing customer needs and pain points.
In its most basic form, journey mapping starts by compiling a series of user goals and actions into a timeline skeleton. Next, the skeleton is fleshed out with user thoughts and emotions in order to create a narrative. Finally, that narrative is condensed into a visualization used to communicate insights that will inform design processes.
Characteristics:
- The map is tied to a specific product or service.
- It is split into 4 swim lanes: phases, actions, thoughts, mindsets/emotions.
- It reflects the user’s perspective:
- Including her mindset, thoughts, and emotions
- Leaving out most process details
- It is chronological.
- There is one map per persona/user type (1:1 mapping).
Why use it:
- To pinpoint specific customer journey touchpoints that cause pain or delight
- To break down silos to create one shared, organization-wide understanding of the customer journey
- To assign ownership of key touchpoints in the journey to internal departments
When to use it:
-
At any point in the design process, as a reference point amongst a team throughout a product design cycle
Experience Mapping
Experience maps generalize the concept of customer-journey maps across user types and products.
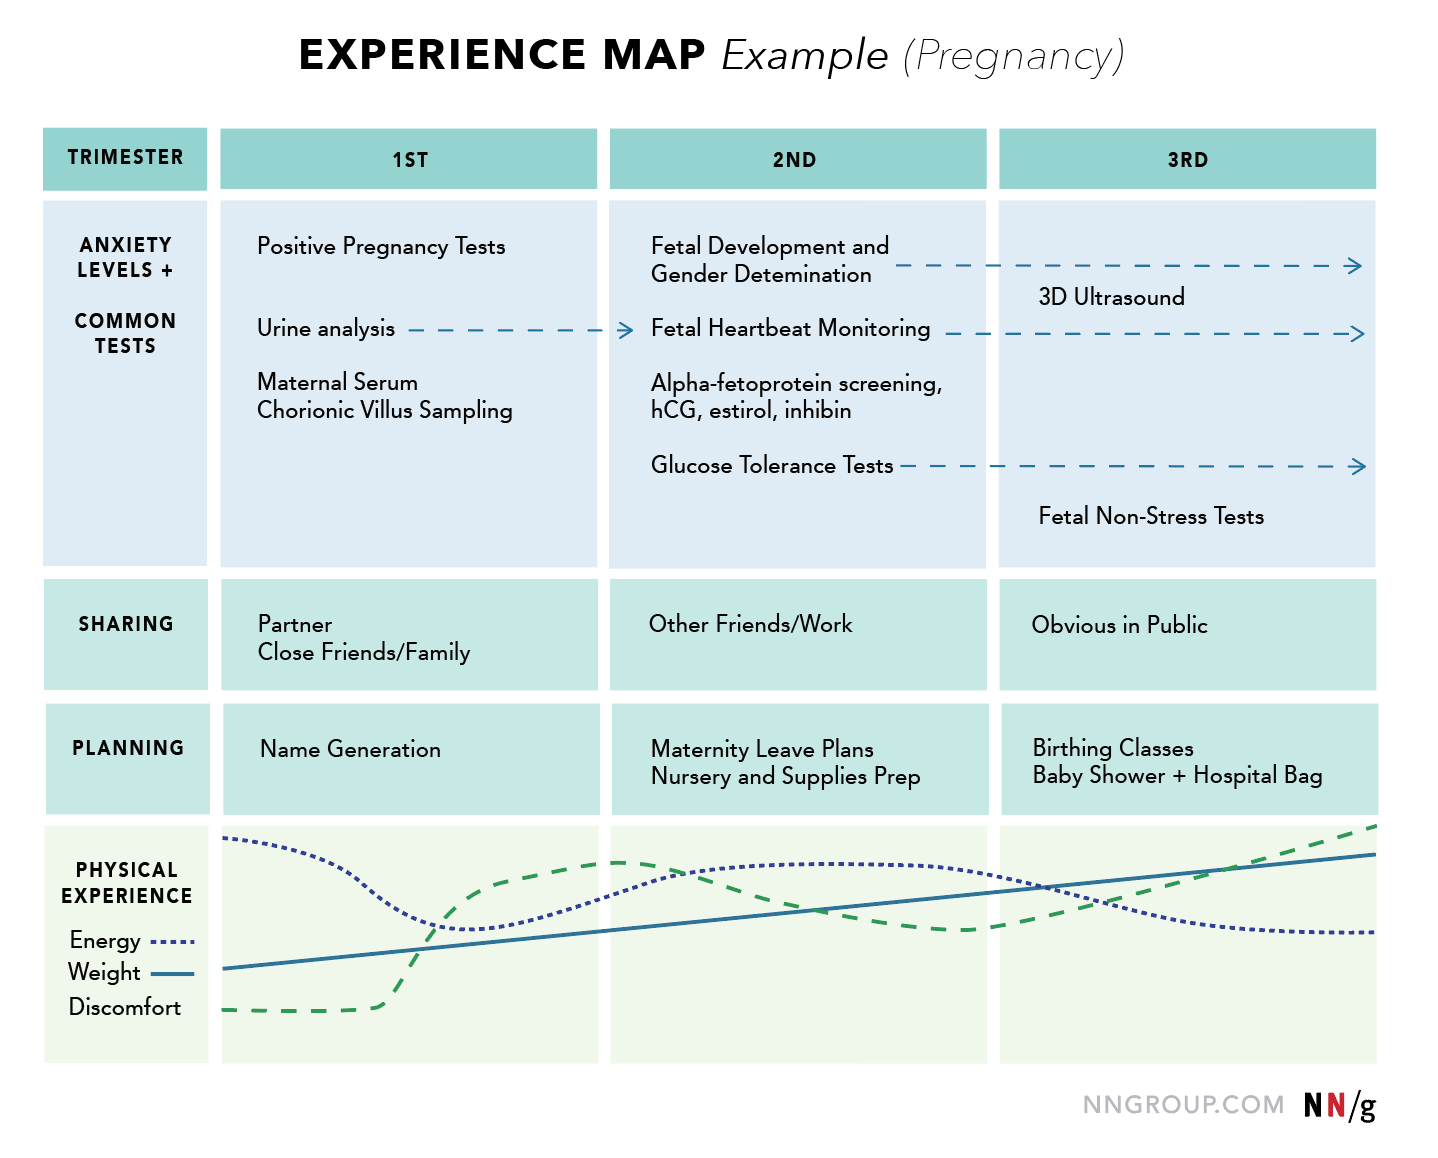
Experience map: A visualization of an entire end-to-end experience that a “generic” person goes through in order to accomplish a goal. This experience is agnostic of a specific business or product. It’s used for understanding a general human behavior (as opposed to a customer journey map, which is more specific and focused on related to a specific business).
Characteristics:
- It is not tied to a specific product or service.
- It is split into 4 swim lanes: phases, actions, thoughts, mindsets/emotions.
- It offers a general human perspective; it is not a specific to a particular user type or product/service.
- It depicts events in chronological order.
Why use it:
- To understand a general human behavior
- To create a baseline understanding of an experience that is product/service agnostic
When to use it:
- Before a customer journey map in order to gain understanding for a general human behavior
- When converging multiple experiences (tool and specific user agnostic) into one visualization
Service Blueprinting
Service blueprints are counterparts to customer journey maps, focused on the employees.
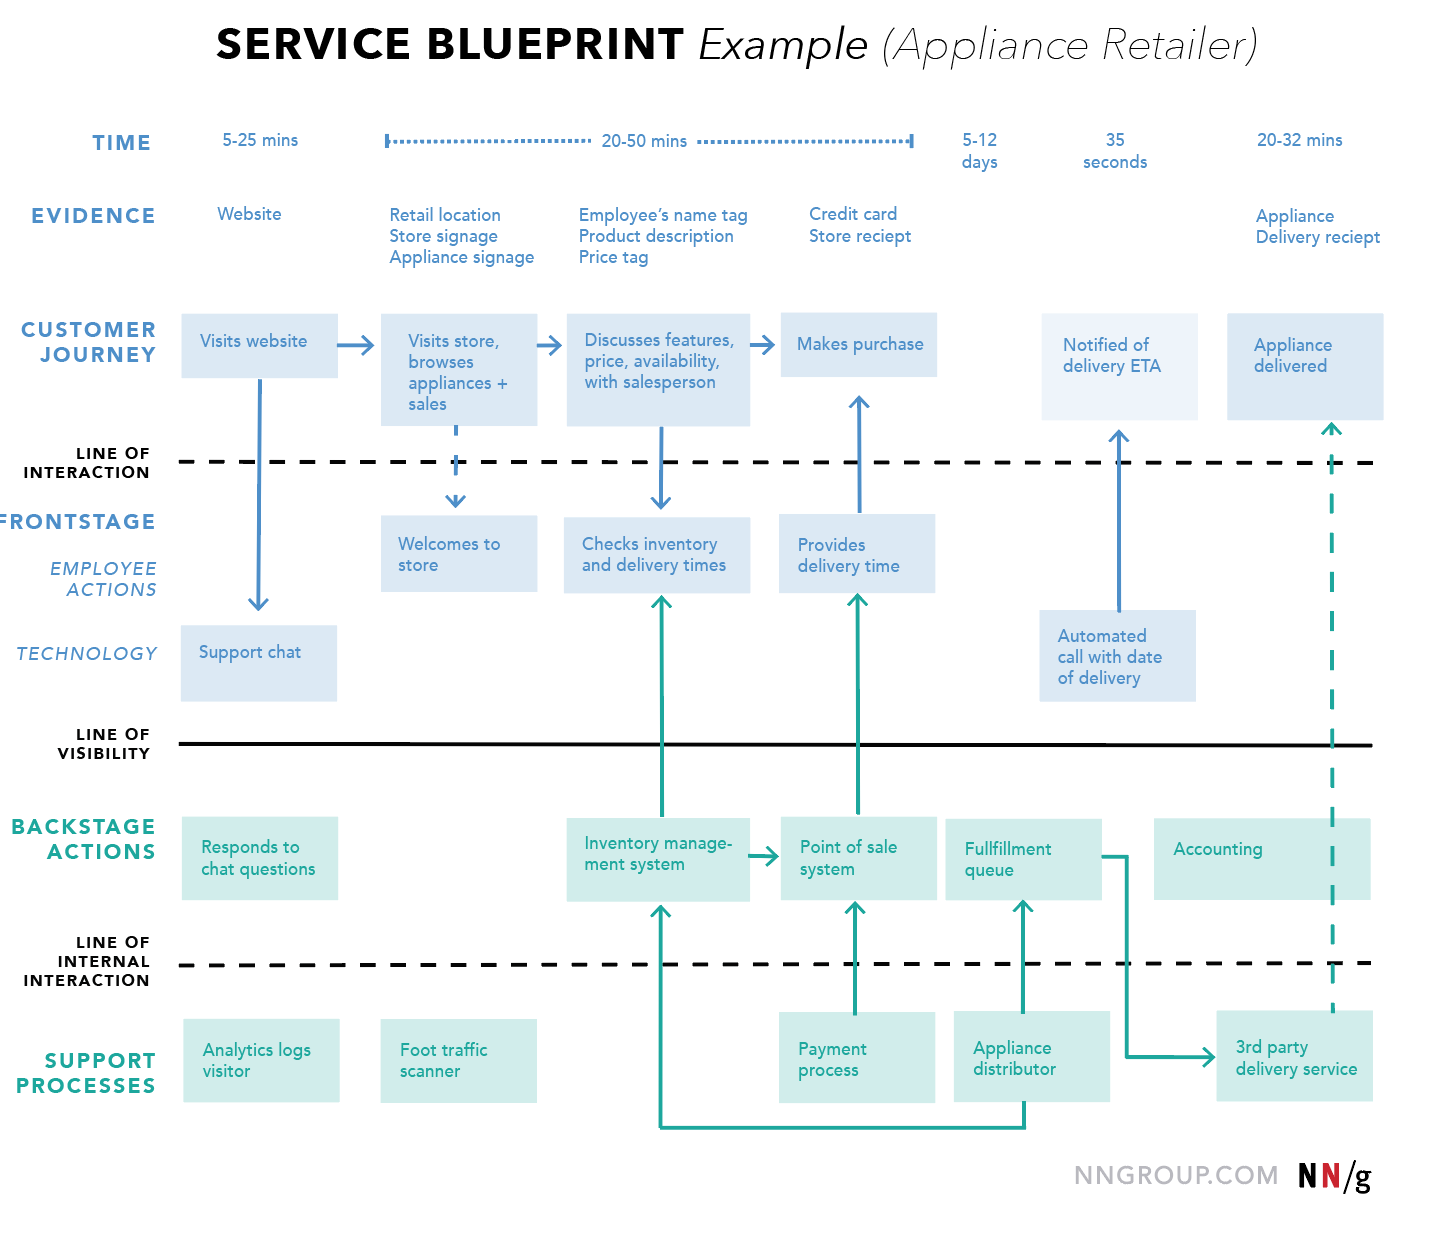
Service blueprint: A visualization of the relationships between different service components — people, props (physical or digital evidence), and processes — that are directly tied to touchpoints in a specific customer journey.
Think of service blueprints as a part two to customer journey maps. Similar to customer journey maps, blueprints are instrumental in complex scenarios spanning many service-related offerings. Blueprinting is an ideal approach to experiences that are omnichannel, involve multiple touchpoints, or require a crossfunctional effort (that is, coordination of multiple departments).
Characteristics:
- It is tied to a specific service.
- It is split into 4 swim lanes: customer actions, frontstage actions, backstage actions, and support processes.
- It reflects the organization’s perspective:
- Focusing on the service provider and employees
- Leaving out most customer details
- It is chronological and hierarchical.
Why use it:
- To discover weaknesses in the organization
- To identify opportunities for optimization
- To bridge crossdepartment efforts
- To break down silos and create one shared, organization-wide understanding of how the service is provided
When to use it:
- After customer journey mapping
- Before making organizational or process changes
- When pinpointing a funnel or breakpoint internally
Three-Step Decision Framework
Before beginning any mapping effort (regardless of the type), 3 decisions must be made:
1. Current (as-is) vs. future (to-be)
This decision involves the actions and states depicted in the visualization: do they reflect the current state of the world or a desired state of the world?
- Current mappings are based on an actual “today” state of what you are mapping. This approach is ideal when the mapping goal is to identify and document existing problems and pain points. Use current state maps to help analyze research or align a team around a data-validated problem.
- Future mappings are based on an “ideal” state for a user type, experience, or a to-be service structure. Future state maps help reinvent and conceive how a user or experience would feel in the future. Use future state maps to set a benchmark or goal for the ideal form of your product or service.
2. Hypothesis vs. research
This decision depends on the type of input that you will use to build your mapping.
- Hypothesis mappings are based on an accumulation of existing understanding within a team or organization. This approach is a great way to merge multiple existing team views, create a research plan (based on the gaps that emerge from your hypothesis map), and make a first step towards a higher-fidelity, research-based map.
- Research mapping is based on data gathered specifically for building the map. This approach is best when there are time and resources dedicated to creating a research plan. While this method creates the best maps, it takes time and significant buy-in. Regardless of where you start, your maps should be iterative and constantly updated with new findings.
3. Low-fidelity vs. high-fidelity
This decision pertains to the quality of the final map visualization.
- Low-fidelity maps are unpolished and often created with sticky notes in a flexible, unrefined manner. These maps are best in an early part of the process. Low fidelity means little commitment or creation effort and empowers people to collaborate, revise, and update as needed. Use sticky notes (physically on the wall or digitally with tools like Mural.co) or collaborative excel sheets.
- High-fidelity maps are polished, created digitally, and look final. High fidelity maps are the best for creating an artifact that is going to be shared amongst many. High fidelity can be easier to read but less flexible because of the “finished” nature of the product. These maps are often created digitally and then dispersed.
Use All Four UX Mapping Methods
All UX maps have two-fold benefits. First, the process of creating a map forces conversation and an aligned mental model. Second, the shared artifact resulting from the mapping can be used amongst your team, organization, or partners to communicate an understanding of your user or service. This artifact can also become the basis for decision making as the team moves forward.
Using one mapping method over another will not make or break a project. Ideally, a combination of all four will be used as needed at different points in your process to create an in-depth understanding of your users and organization.
References
Kyle, Beth. Pregnancy Experience Map. http://www.bethkyle.com/portfolio-item/pregnancy-experience-map/


